| The Content Variation of Natural Product Induced by Different Factor(s) | |||||||||||||||||||||||||||||||||||||||||||||||||||||||||||||||||||||||||||||||||||||||||
|---|---|---|---|---|---|---|---|---|---|---|---|---|---|---|---|---|---|---|---|---|---|---|---|---|---|---|---|---|---|---|---|---|---|---|---|---|---|---|---|---|---|---|---|---|---|---|---|---|---|---|---|---|---|---|---|---|---|---|---|---|---|---|---|---|---|---|---|---|---|---|---|---|---|---|---|---|---|---|---|---|---|---|---|---|---|---|---|---|---|
| Species Name: Chelidonium majus | |||||||||||||||||||||||||||||||||||||||||||||||||||||||||||||||||||||||||||||||||||||||||
| Factor Name: Locality Variation; Harvest Time Variation | [1] | ||||||||||||||||||||||||||||||||||||||||||||||||||||||||||||||||||||||||||||||||||||||||
| Experiment Detail |
Aerial parts from five populations of Chelidonium majus were collected from the wild at the flowering stage (hereafter referred to as 'wild') for chemical analysis and biological activity testing during May 2019. Ten randomly selected plantlets were also collected from the same five populations in 2019 and planted in an organically certified experimental field of IES (57° 19′ 11.7″ N 25° 19′ 18.8″ E, 115 m altitude). The plot size was 0.8 m2, and the plant spacing was 0.2 × 0.5 m. A year later, aerial parts were collected during the flowering stage from the same populations in the experimental field (hereafter referred to as 'cultivated').
Click to Show/Hide
|
||||||||||||||||||||||||||||||||||||||||||||||||||||||||||||||||||||||||||||||||||||||||
| Factor Function |
The total content of alkaloids in aqueous ethanol extracts prepared from cultivated C. majus specimens was higher than that observed in extracts prepared from wild-grown plant material. Chelidonine, sanguinarine, and chelerythrine were the main contributors to the total increase in alkaloid content. The cultivation of C. majus did not significantly affect the total content of flavonol glycosides. The observed differences in the phytochemical compositions of the C. majus extracts resulted in significant increases in the cytotoxic activities of the preparations.
Click to Show/Hide
|
||||||||||||||||||||||||||||||||||||||||||||||||||||||||||||||||||||||||||||||||||||||||
| Factor | Part | Location | NP Content | ||||||||||||||||||||||||||||||||||||||||||||||||||||||||||||||||||||||||||||||||||||||
|
Locality: wild + Harvesting time: 2019
|
Aerial parts | Latvia |
NP Content: 135.9 ± 130.8 µg/g
|
||||||||||||||||||||||||||||||||||||||||||||||||||||||||||||||||||||||||||||||||||||||
|
Locality: experimental field + Harvesting time: 2020
|
Aerial parts | Latvia |
NP Content: 53.5 ± 12.9 µg/g
|
||||||||||||||||||||||||||||||||||||||||||||||||||||||||||||||||||||||||||||||||||||||
| Species Name: Chrysanthemum morifolium Ram. cv. 'Gaya yellow' | |||||||||||||||||||||||||||||||||||||||||||||||||||||||||||||||||||||||||||||||||||||||||
| Factor Name: Photosynthetic Active Radiation Treatment | [2] | ||||||||||||||||||||||||||||||||||||||||||||||||||||||||||||||||||||||||||||||||||||||||
| Experiment Detail |
After acclimation, the plants were grown independently in different light treatment chambers at 20 ± 0.2 ℃ and 65 ± 2% humidity until the harvest date (35 days after light treatment). The white fluorescent light (70 ± 5 µmol/m2/s) was maintained for 12 h, and then each of the blue, green, red, and white lights was irradiated at 70 ± 5 µmol/m2/s for 4 h using LED arrays (DR LED Networks Co., Seoul, Republic of Korea). The spectral energy distribution of four different LED arrays was measured from 300 to 800 nm with a spectroradiometer (International Light, RPS-900, U.S.). Their maximum spectral wavelengths were 463 (blue), 518 (green), and 632 nm (red); the white LEDs had a broad spectrum. Irradiance was measured using a quantum sensor (LI-COR, LI-191, Lincoln, NE, U.S.). Water was supplied daily with top irrigation and a nutrient solution (Hoagland, pH = 5.9 ± 0.2, electrical conductivity = 1.2 dS/m) every 4 days until harvest.
Click to Show/Hide
|
||||||||||||||||||||||||||||||||||||||||||||||||||||||||||||||||||||||||||||||||||||||||
| Factor Function |
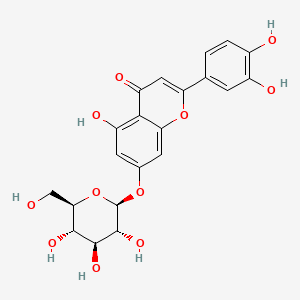
A quantitation and principal component analysis biplot demonstrated that luteolin-7-O-glucoside (2), luteolin-7-O-glucuronide (3), and quercetagetin-trimethyl ether (8) were the highest polyphenols yielded under green light, and dicaffeoylquinic acid isomer (4), dicaffeoylquinic acid isomer (5), naringenin (7), and apigenin-7-O-glucuronide (6) were greatest under red light. Chlorogenic acid (1) and 1,2,6-trihydroxy-7,8-dimethoxy-3-methylanthraquinone (9) were produced in similar concentrations under both light types. The white and blue light appeared inefficient for polyphenol production.
Click to Show/Hide
|
||||||||||||||||||||||||||||||||||||||||||||||||||||||||||||||||||||||||||||||||||||||||
| Factor | Part | Location | NP Content | ||||||||||||||||||||||||||||||||||||||||||||||||||||||||||||||||||||||||||||||||||||||
|
Under blue light (spectral wavelengths: 463 nm)
|
leaf | Korea |
NP Content: 4.8 ± 0.5 mg/kg
|
||||||||||||||||||||||||||||||||||||||||||||||||||||||||||||||||||||||||||||||||||||||
|
Under green light (spectral wavelengths: 518 nm)
|
leaf | Korea |
NP Content: 13.2 ± 0.1 mg/kg
|
||||||||||||||||||||||||||||||||||||||||||||||||||||||||||||||||||||||||||||||||||||||
|
Under red light (spectral wavelengths: 632 nm)
|
leaf | Korea |
NP Content: 13.9 ± 1.9 mg/kg
|
||||||||||||||||||||||||||||||||||||||||||||||||||||||||||||||||||||||||||||||||||||||
|
Under white light (spectral wavelengths: broad spectrum)
|
leaf | Korea |
NP Content: 5.7 ± 1.3 mg/kg
|
||||||||||||||||||||||||||||||||||||||||||||||||||||||||||||||||||||||||||||||||||||||
